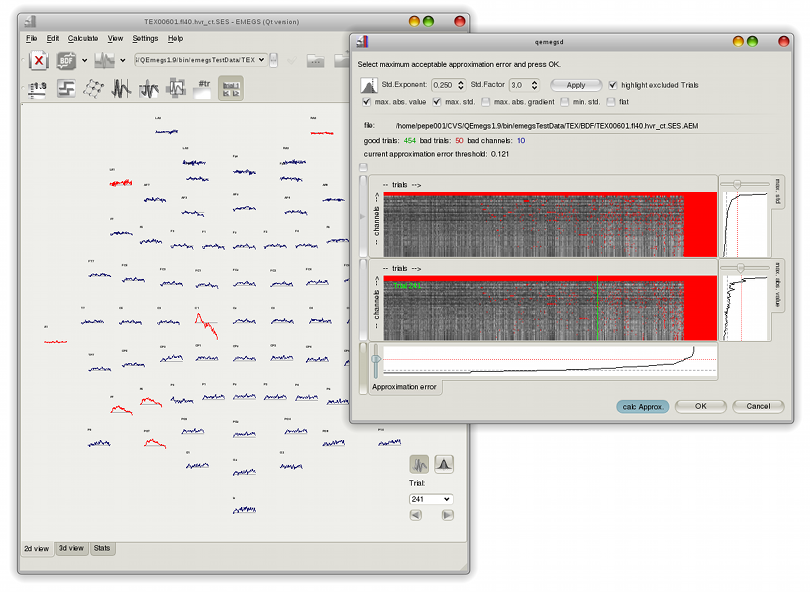


This dialog allows to manually set various thresholds on
statistical parameters to sort good from bad data segments,
channels and trials. Parameters are calculated beforehand and
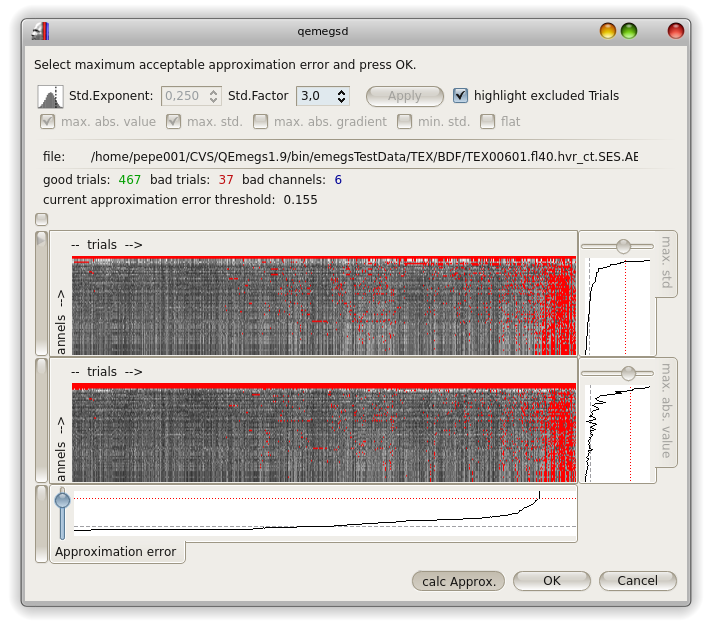
stored in an *.AEM file. For each active parameter (max abs. value, max. std, min. std,
max. abs. gradient and flat) a row of display objects is shown. The
default setting is to use only max.
abs. value and max.
std as in the screenshot below. The gray shaded bitmap
graphically visualizes the value of the corresponding statistical
parameter for all channels and trials in the data file: channels
are arranged vertically (each row is one channel), trials
horizontally (each column is on trial). Initially channels are
sorted according to their sequence in the data file and trials are
ordered chronologically. The leftmost buttons on each row allows
channel sorting by an index corresponding the deviation of each
channel from the other channels on that parameter. Thus, channels
with extreme values (low or high) on the corrsponding parameter
get higher values and therefore are most likely to be excluded.
This index is plotted as a line graph on the right side of the
parameter row. A slider above each graph is used to define
the threshold.
The bottom row of the dialog is disabled until the trial
approximation error has been calculated by clicking the calc Approx. button. The
leftmost button in the Approximation
error row (bottom row) allows trial sorting by the
approximation error, which corresponds roughly the trial quality.
You can then move the slide on the left of the approximation error
row to define the maximum acceptable approximation error,
excluding all trials above the red line. Click OK to save the
threshold and continue processing.
The screenshot shown above is a parameter display sorted by max. std and by Approximation error. In this
way, trials on the right side and channels at the top are
excluded.
To inspect the corresponding trials, make sure the main window
behind this dialog is visible (using KDE4 and 3d desktop effects,
you may need to disable darkening of the parent window), then
double-click on the bitmaps to initiate the display of the
corresponding trials in the main window. Good channels are drawn
in blue, bad channels in red. The activated trial is indicated in
the artefact threshold dialog.

You can double-click on each bitmap to display the corresponding
trial with good and bad channels in the data window to get a
better impression of the data quality.
After setting the artefact threshold, detailed editing
information is stored in a text file (*.WE.TXT) in your data
folder.